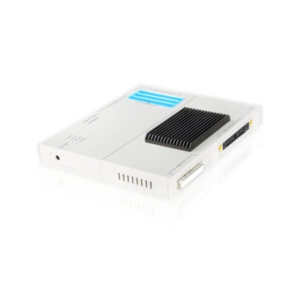
Description
Highlights
- Support of High-Speed Serial Trace Port (ETM-HSSTP, ARM specified)
- Compatible to Xilinx Aurora protocol
- Support of up to four differential lanes
- Maximum 6,25Gbit/s lane speed
- Up to 4 GByte trace buffer size, sufficient for up to 24 Giga CPU cycles
- Support for ARM, Cortex-R4
Introduction
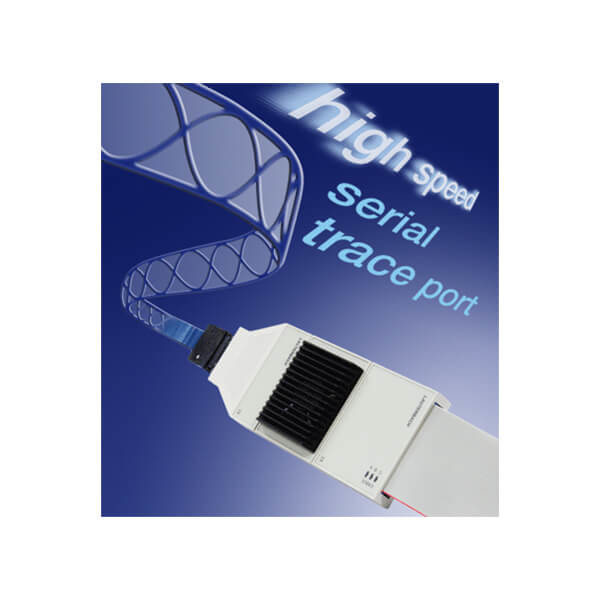
The High-Speed Serial Trace Port (HSSTP) is based on the Xilinx Aurora protocol. Parallel tracedata of the target CPU (e.g ARM-ETMv3.x) is coded 8b/10b and converted to a serial bit stream. This is sent by differential signal lines to the TRACE32 preprocessor which recovers the original parallel data.
Up to four differential lanes with data rates of up to 6.25Gbit/s are supported by the TRACE32 preprocessor hardware.
The High-Speed Serial Trace Port is supported with PowerTrace-II only. It provides time stamp features and can serve the filter and trigger capabilities of the ETM.
Trace Extension for Serial Trace Port
The PowerTrace samples all trace port lines up to a speed of 500 MHz into the trace buffer. The maximum size of the trace buffer is 64/128 MFrames (1 frame per clock).
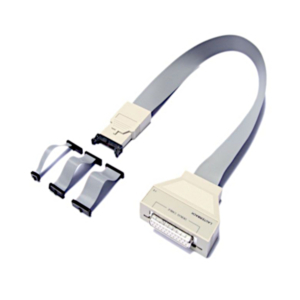
The connection to the target is done by standardized adapters defined by the manufacturer. The system can run on PCs or any workstation.
Serial-Trace-Port: Trace Features For Advanced Debugging

- Sample only the specified event
- Sample the complete program flow and the specified data event
- Switch the sampling to the trace buffer on/off after a specified event occurred

- Allows re-debuggging of a traced program section
- Provides forward and backward debugging capabilities
- High-level language trace display including all local variables
- Timing and function nesting display
- Has the ability to fill most trace gaps caused by the limited bandwidth of trace port

- Fills in missing code
- Direct branch reconstruction
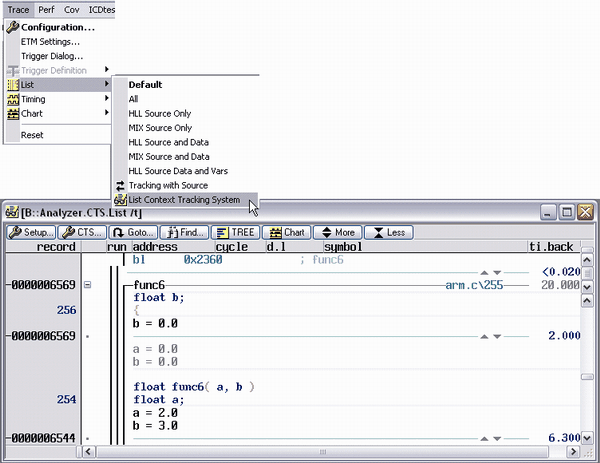
- Indirect branch reconstuction with CTS
- Memory and Register values from CTS

- Realtime measurement of 3 current and 4 voltage lines
- Realtime trigger on current, voltage and power
- Time correlation with other TRACE32 tracetools
- Energy statistics on function and task level
- Fully integrated in the TRACE32 user interface
Serial-Trace-Port: Trace Features For Runtime Analysis
- Detailed analysis of function run-times
- Detailed analysis of task run-times and state
- Graphical analysis of variable values over the time
- Analysis of the time interval of a single event (e.g. Interrupt)
- Analysis of the time interval between 2 defined events
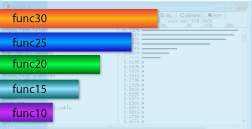
- Long-time performance analysis for functions
- Long-time performance analysis for tasks
- Long-time analysis of the contents of a variable or memory location and more
Serial-Trace-Port: Trace Features For Quality Assurance And Optimizing
- Real-time code coverage without instrumentation
- Suitable for long-term testing
- Support for all common code coverage metrics
- Automated report generation
- Full support of multicore chips

- Basic support for all microcontrollers
- Advanced support for ARM architecture
- Optimize instruction and data cache usage
- Find bus transfer bottlenecks
- Verify effects of code optimisation
- Simulate effects of different cache sizes
- Various graphical and numerical displays
Speed
The max. supported speed of the Serial Trace Port depends on the number of differential trace port lanes.
- 6.250 Gbit/s per lane (up to three lanes)
- 3.125 Gbit/s per lane (at four lanes)
Trace Display
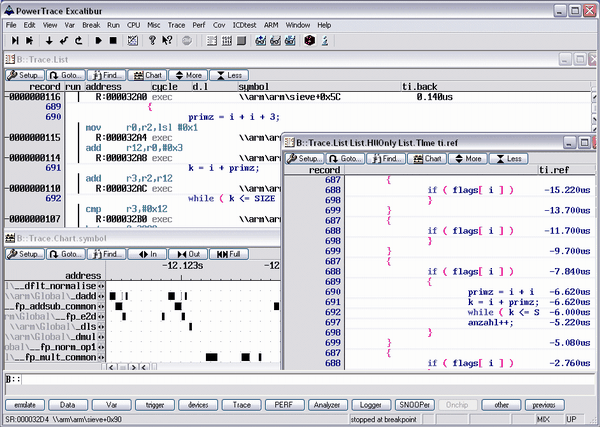
TRACE32 offers a comprehensive trace display and analysis.
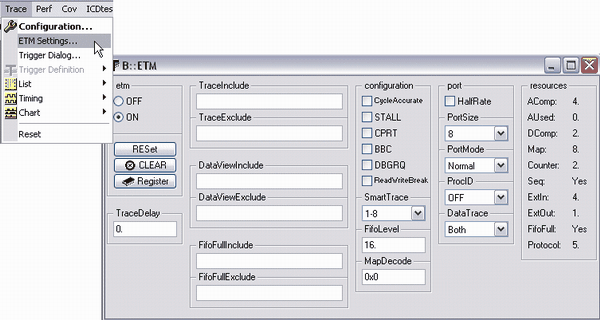
ETM Settings
TRACE32 offers intuitive access to all ETM settings.
Basic ETM Filter and Trigger
The basic filter and trigger features are easy to use.
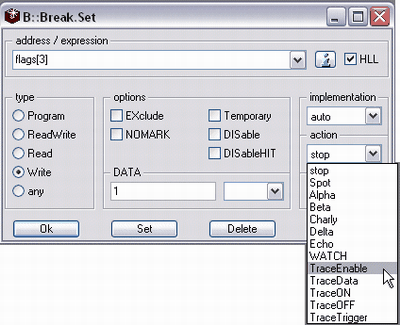
- TraceEnable: Sample only the specified event.
- TraceData: Sample the complete program flow and the specified data event.
- TraceON: Switch the sampling to the trace buffer on after the specified event occurred.
- TraceOFF: Switch the sampling to the trace buffer off after the specified event occurred.
- TraceTrigger: Stop the sampling to the trace buffer at the specified event. A trigger delay is possible.
3-States Sequencer
The programming for the 3 state sequencer is supported by a special dialog window.
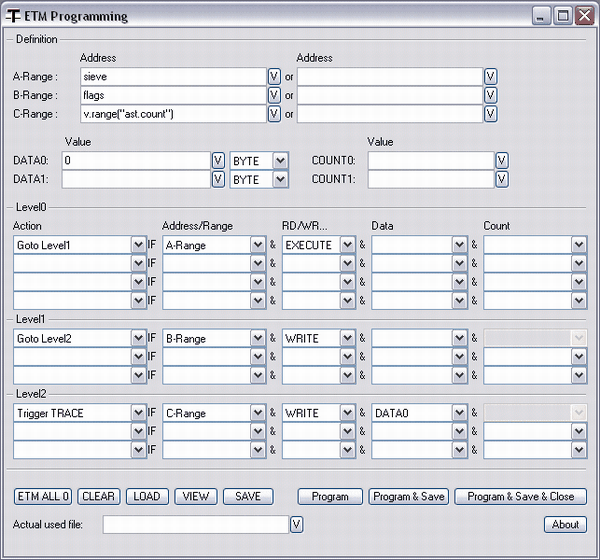
Reconstruction of Trace Gaps
A large number of indirect branches or a large number of data transfer can cause an overflow of the internal ETM FIFO. The result is, that trace information is lost. TRACE32 can reconstruct such trace losses with the SmartTrace and CTS.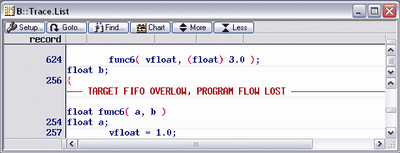
Code Coverage
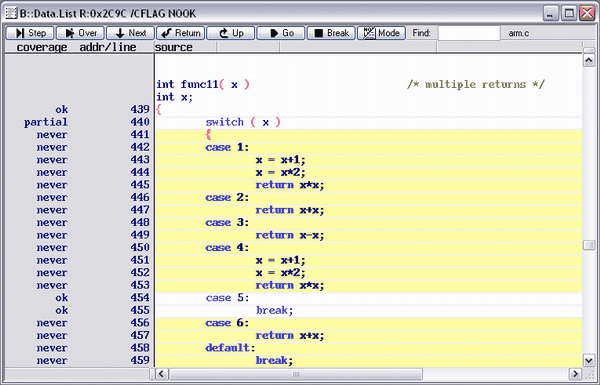
If a PowerTrace is used, a hardware based code coverage can be performed on a 4 x 4 MByte code range. The code coverage includes executed/not executed and branch taken/not taken.

