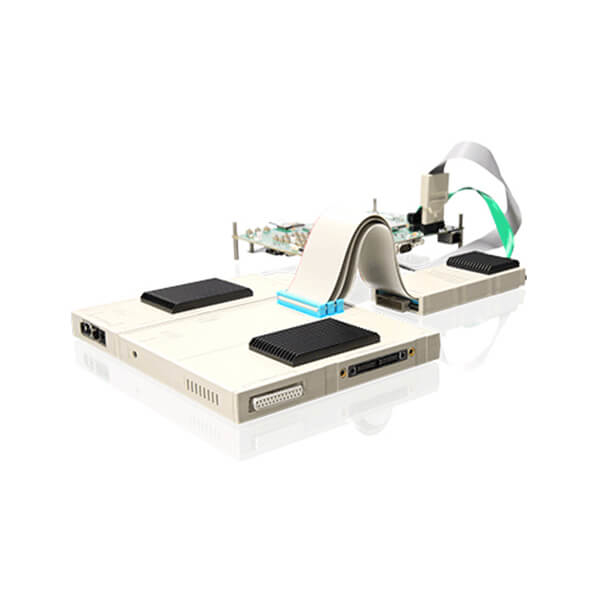
Description
Highlights
- Up to 4 GByte trace buffer
- Target voltage 1.2 .. 3.3 V
- 5 ns time stamp
- Program and data trace
- Performance analysis
- Function and task run-time measurement
- Code coverage
- Support for Embedded Trace Macrocell (ETM), Program Trace Macrocell (PTM)
- Support for Embedded Trace Buffer (ETB), Trace Memory Controller (TMC), Trace Port Interface Unit (TPIU)
- Support for multiple trace sources in a single stream (CoreSight trace)
Introduction
The PowerTrace or the PowerTrace-II for the ARM ETM/PTM samples all trace data with rates up to 600 Mbit/s per trace channel into the trace buffer.
It supports the Embedded Trace Macrocell (ETM) as well as the Program Trace Macrocell (PTM).
The trace provides time stamp features and can serve the filter and trigger capabilities of the ETM/PTM. The system can run on PCs or any workstation.
The connection to the target is done by standardized adapters defined by ARM.
Self Calibration
More than 600 Mbit/s per trace channel with trace adapters using AUTOFOCUS self calibration technology.

Trace Display
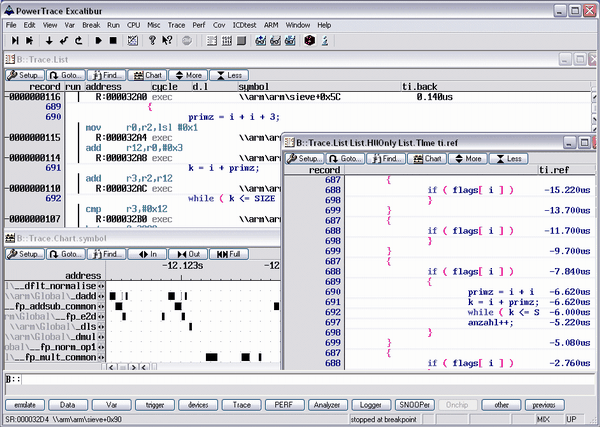
TRACE32 offers a comprehensive trace display and analysis.
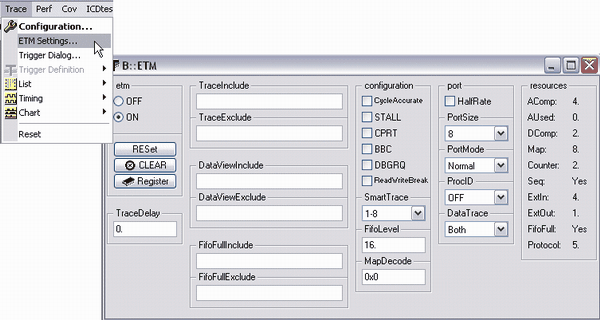
ETM Settings
TRACE32 offers intuitive access to all ETM settings.
Basic ETM Filter and Trigger
The basic filter and trigger features are easy to use.
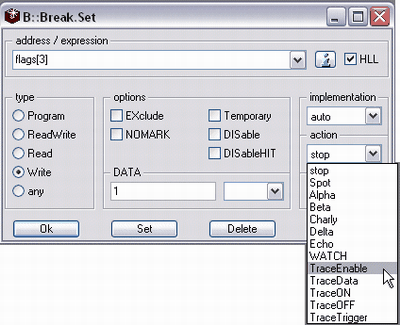
- TraceEnable: Sample only the specified event.
- TraceData: Sample the complete program flow and the specified data event.
- TraceON: Switch the sampling to the trace buffer on after the specified event occurred.
- TraceOFF: Switch the sampling to the trace buffer off after the specified event occurred.
- TraceTrigger: Stop the sampling to the trace buffer at the specified event. A trigger delay is possible.
3-States Sequencer
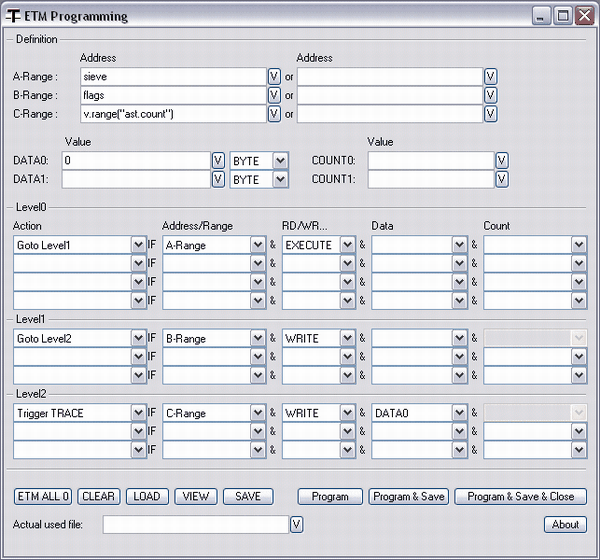
The programming for the 3 state sequencer is supported by a special dialog window.
Additional Standard Trace Features
- Detailed analysis of function run-times
- Detailed analysis of task run-times and state
- Graphical analysis of variable values over the time
- Analysis of the time interval of a single event (e.g. Interrupt)
- Analysis of the time interval between 2 defined events
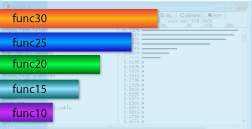
- Long-time performance analysis for functions
- Long-time performance analysis for tasks
- Long-time analysis of the contents of a variable or memory location and more
- Allows re-debuggging of a traced program section
- Provides forward and backward debugging capabilities
- High-level language trace display including all local variables
- Timing and function nesting display
- Has the ability to fill most trace gaps caused by the limited bandwidth of trace port

- Realtime measurement of 3 current and 4 voltage lines
- Realtime trigger on current, voltage and power
- Time correlation with other TRACE32 tracetools
- Energy statistics on function and task level
- Fully integrated in the TRACE32 user interface
- Real-time code coverage without instrumentation
- Suitable for long-term testing
- Support for all common code coverage metrics
- Automated report generation
- Full support of multicore chips
Reconstruction of Trace Gaps
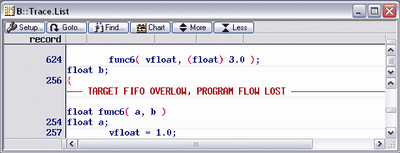
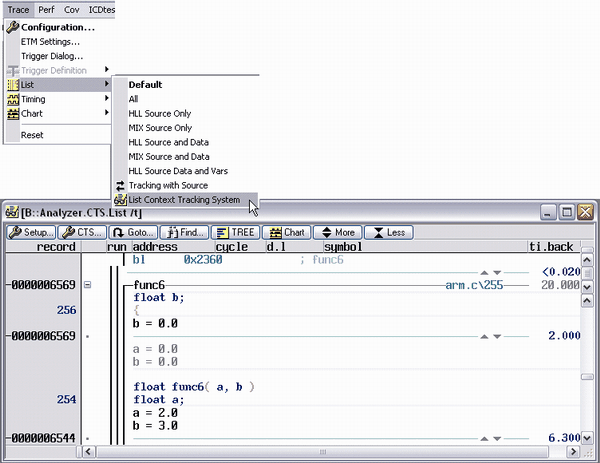
A large number of indirect branches or a large number of data transfer can cause an overflow of the internal ETM FIFO. The result is, that trace information is lost. TRACE32 can reconstruct such trace losses with the SmartTrace and CTS.
Adaption Methods
FLEX Adapters
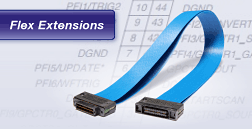
- Highly Flexible Adapters
- For Debuggers and ICD Trace
- High Signal Quality
- Adapted Impedance
- MICTOR
- 100 MIL
- SAMTEC
- YAMAICHI
Details and Configurations


